In my classroom: Mathematical modeling of Influenza spread (and comparison to Coronavirus COVID-19)
Every biology classroom is likely teeming with discussions about COVID-19. This offers a unique opportunity to share real-time data and situations with students. Each day brings new developments in this world public health crisis. How are the epidemiologists working to temper the spread?
This week, I adapted a lesson plan which I co-developed for high school students as part of the CDC.gov Science Fellowship program in 2014 (1). The plan is “Have You Herd” and is available for free, in its entirety, on the CDC website. Here is the pdf link: https://www.cdc.gov/careerpaths/scienceambassador/documents/hs-have-you-herd-modeling-influenza-2014.pdf which is also listed in references below (2). The lesson has links to NGSS standards on page 14 of the pdf (page 11 if printed hardcopy of lesson).
SEMANTICS NOTE: The novel coronavirus, which is central to the current outbreak, is notated as SARS-CoV2. This virus causes coronavirus disease, identified in 2019, which is notated COVID-19 (3).
Time estimate: 90 minutes-ish, depending on length of discussion and if you assign the pre-lab the night before or have students complete in class.
Why use an influenza lesson to teach about COVID-19? From the CDC website: “the newly emerged coronavirus disease 2019 (COVID-19) is a respiratory disease that seems to be spreading much like flu. Guidance and tools developed for pandemic influenza planning and preparedness can serve as appropriate resources for health departments in the event the current COVID-19 outbreak triggers a pandemic” (4).
Learning Objectives:
After completing this lesson, students should be able to (coronavirus addendums are in parentheses):
• employ mathematical models for influenza (SARS-CoV2) outbreak scenarios to calculate measures of disease spread and intervention effectiveness.
• synthesize effects of physical (e.g., social distancing or non-pharmaceutical interventions) and medical (e.g., vaccines) countermeasures for influenza outbreak scenarios. What are COVID-19 physical countermeasures which can be employed (especially since a vaccine is currently unavailable)?
• identify public health countermeasures that restrict the spread of an influenza (SARS-CoV2) outbreak.
• IF PART 2 OF LESSON IS USED: explain the importance of vaccinations and monitoring cases of infectious diseases. Since there is currently no vaccine is available for COVID-19, this part of the lesson really only works if using only influenza as written. You can discuss that there is a race to create a vaccine to SARS-CoV2.
Overview: I taught the lesson plan as it was written, but added the following components:
- Opening: Make it clear to students that this lab is about influenza, however when appropriate, COVID-19 data will be discussed as a comparison.
- Prelab: Assigned students to make a chart to compare flu to COVID-19. I did this ad hoc, but you could take the basic chart from Appendix 1A and have the students make a second column for COVID-19. I especially like the “misconceptions” line – they could list anything they heard early on about COVID-19. Note that at this time, seasonality of SARS-CoV2 is unknown, so that part of the chart students would leave blank. Another column of “cause” would be helpful to distinguish the difference between COVID-19 to SARS-CoV2 (as noted in the semantics note/paragraph 3, above) versus. influenza to influenza virus A, B or C.
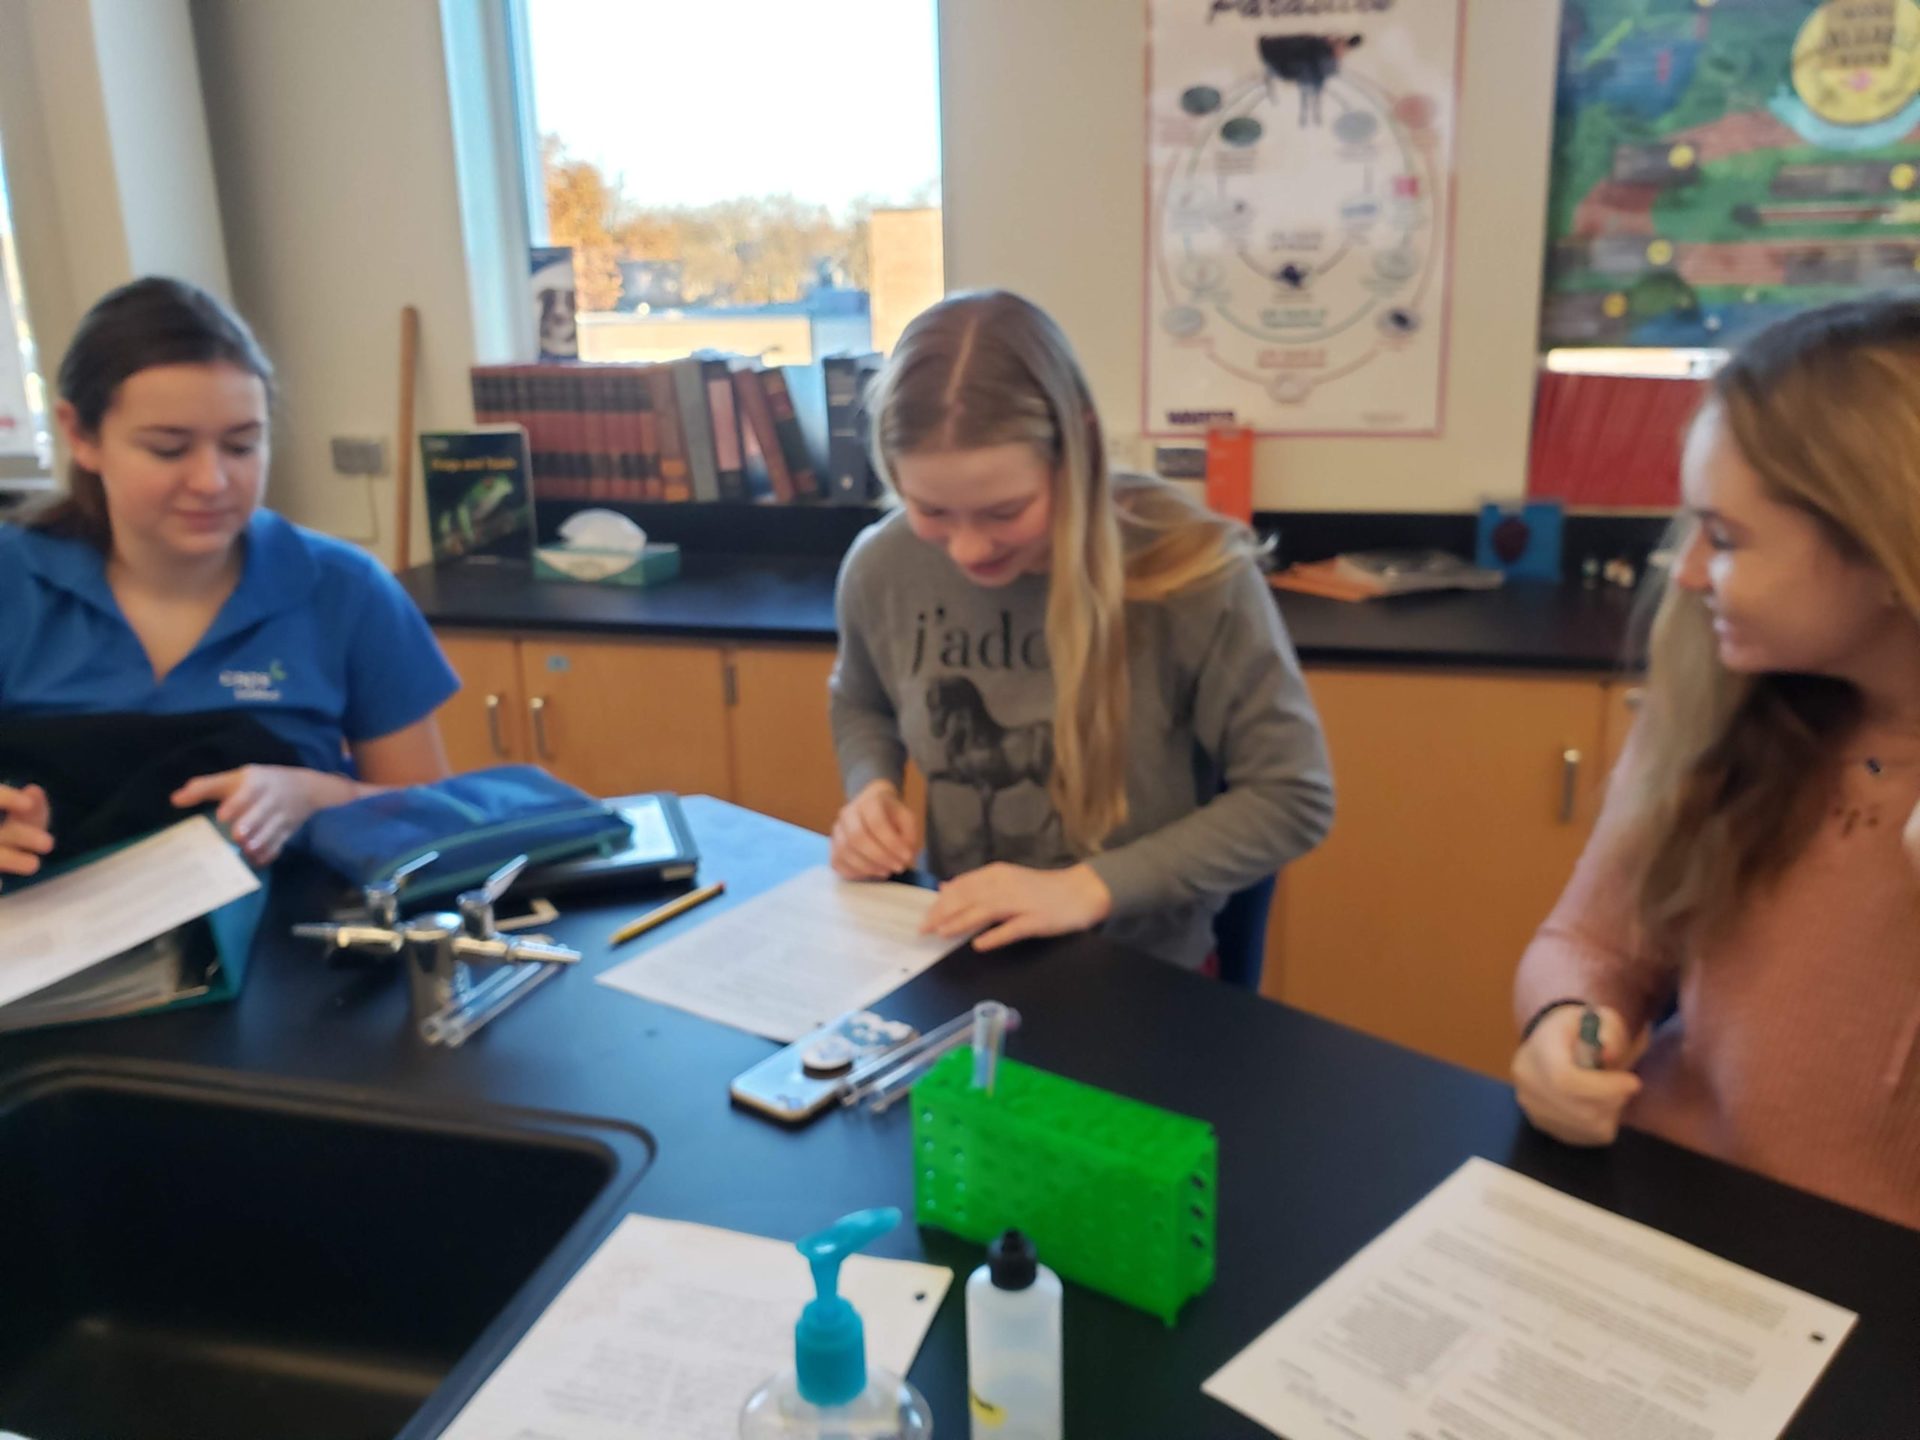
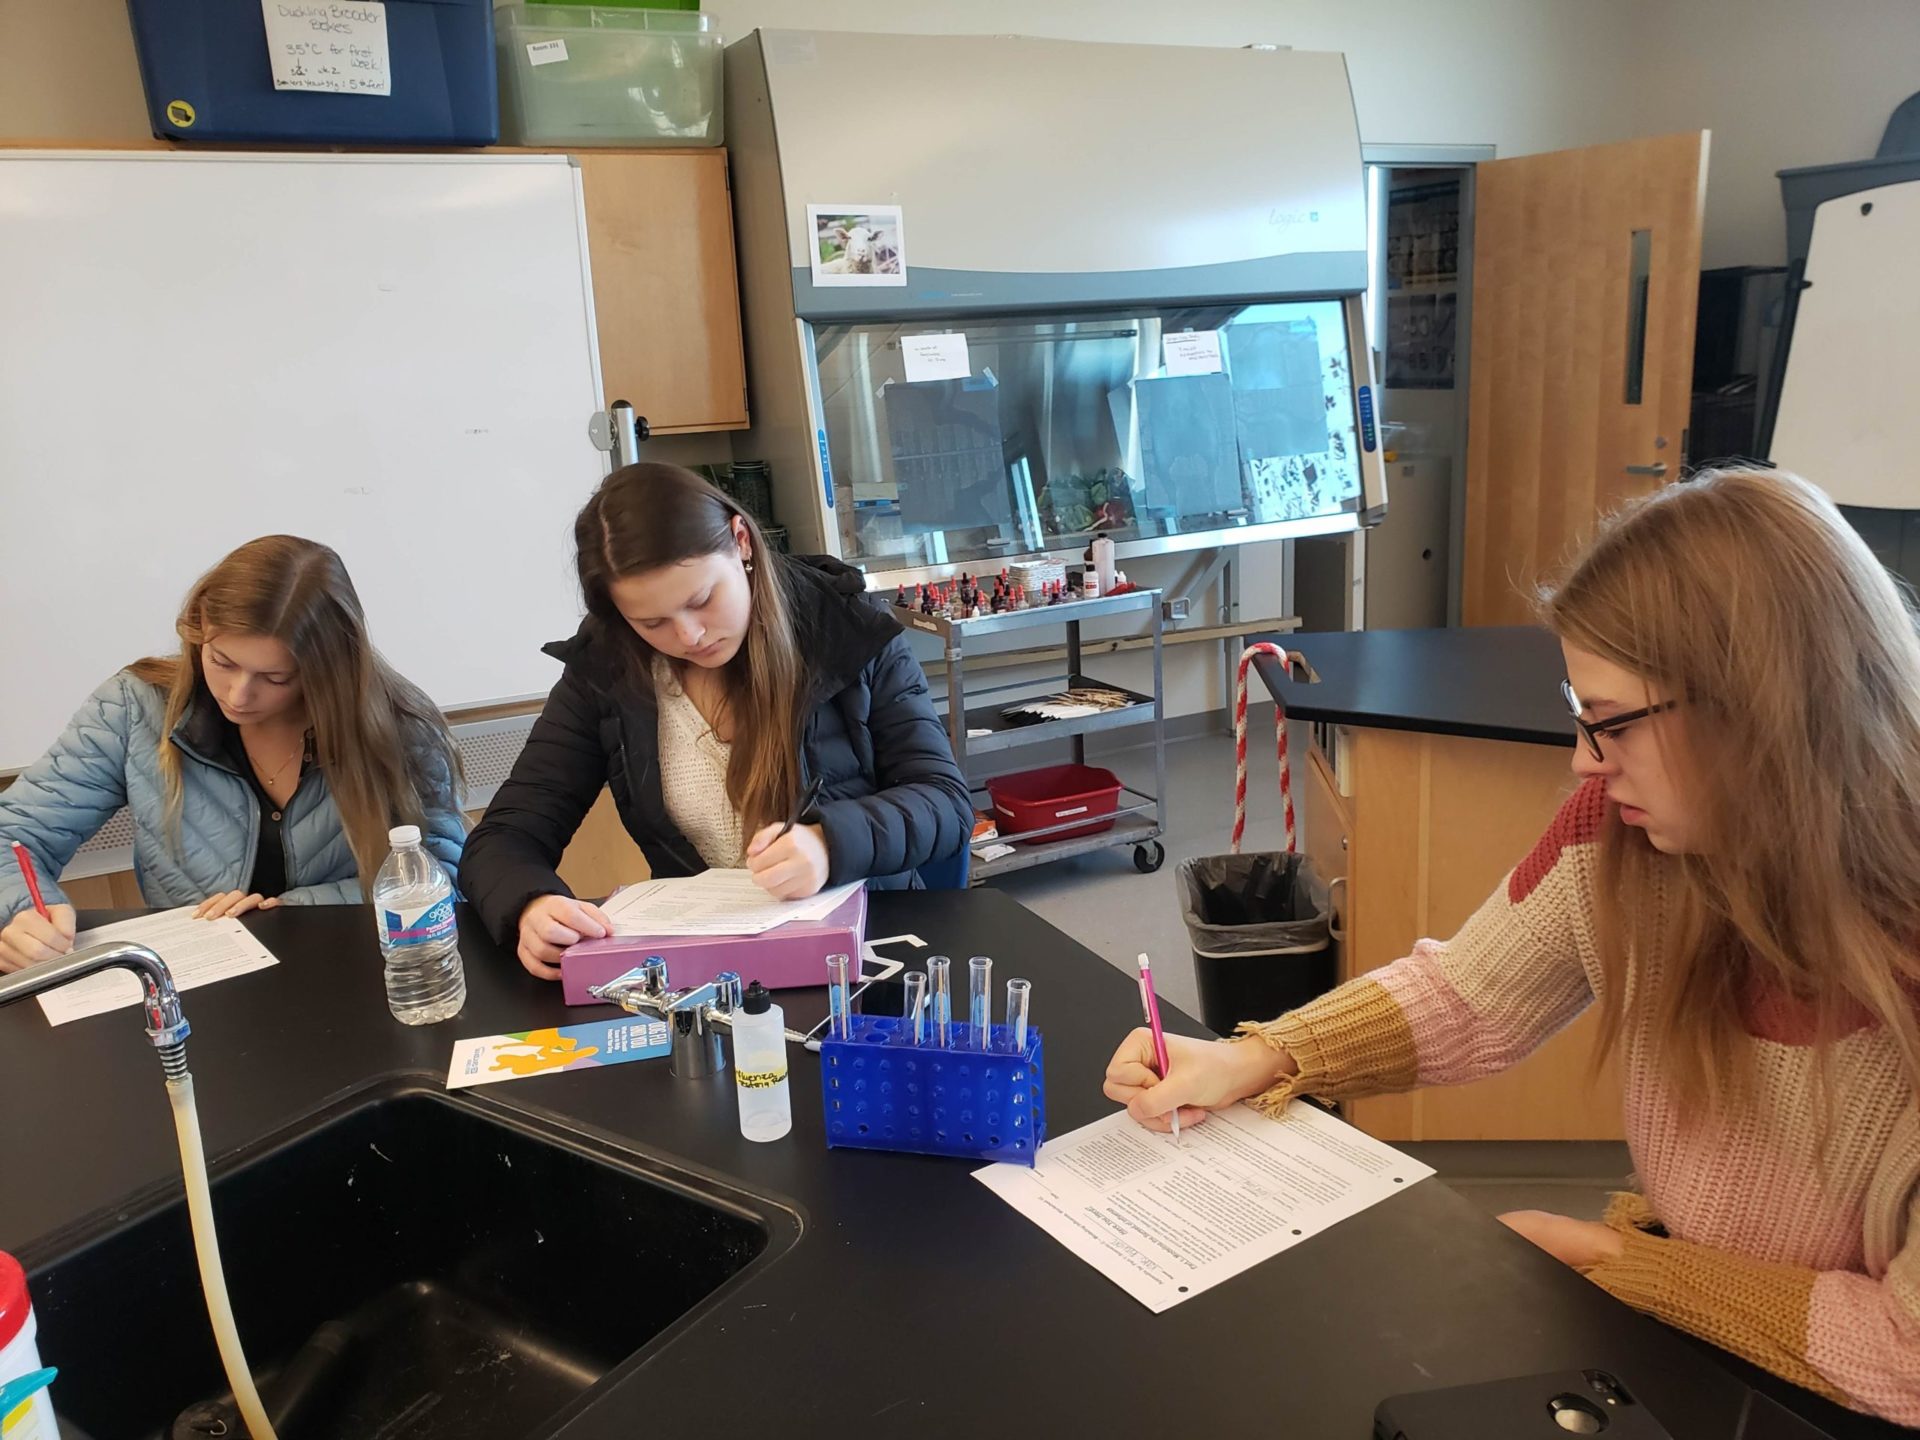
- Worksheet 1: Note that there are three different demographic scenarios to this activity, A-C. One-third of your class should each be given their corresponding version of Worksheet 1. For reference, A = urban/dense population; B = suburban/moderate population density; C= rural/low population density. Wetlab opening – Perform as written in lesson. Point out that the wetlab simulation of rapid influenza test is a nasopharyngeal swab (long Q-tip thing which makes you gag – they will relate). The CDC SARS-CoV2 test kit uses a similar collection method, plus may also collect sputum (6). Tests are described on the CDC website (6). Discussion questions & R0 calculations – Calculate as written. I like to work through this worksheet as a whole class but allowing each group (A-C) to work together to perform their calculations and double check each other. Then we discuss questions as a class. Helpful R0 information is listed in references below (7). Something which struck me as this lesson was developed was that although small towns have less people, therefore less opportunity for interactions with an infected person, the folks an infected person encounters is more likely to be someone they know (closer contact). It is more likely they will hug, shake hands, hug, etc. if they know the person. Thus, your students will see that the scenario C is not too far off from R0 of scenario A. As you conclude the calculations (discussion questions 1-9), compare the various R0 for your three different populations to the R0 value for COVID-19. One source that I found reported R0 for COVID-19 to be anywhere from 1.4 to 4.08 (8). I’ve seen the number in various places and, situationally, it varies, which makes sense. Examples to discuss are a cruise ship vs. various providences in China. Check out the description in that source (8) with a nice comparison of R0 for different diseases. If you are not familiar with R0 and are Googling around, note that it is different than RE (effective reproduction number). RE is addressed in Worksheet 2.
- Worksheet 2: Although optional for the purpose of COVID-19 knowledge (because there currently isn’t a vaccine), I went ahead and had the students work through Worksheet 2 where they calculate herd immunity threshold (Ic) and the critical vaccination level (Vc). We discussed the effective reproduction number (RE) of influenza and who is appearing to be susceptible to COVID-19. CDC has a rapidly changing risk assessment description available on their website (9).
- Assessment (Appendix 4A): I love the figure of genetic evolution of influenza virus H7N9. It really shows how genetic shift occurred in a possible bird/poultry market to generate a novel virus which affected humans in 2013 China. Relate this to the source and spread of SARS-CoV2 (10). Make sure your students know what zoonotic diseases/zoonoses are! Merck Manual online (source 3) is my go-to for animal related information (I teach a veterinary medicine course). Search “zoonotic diseases” on Merck Manual or any credible source.
Extensions: 
- Worksheet 1, before question 3, have actress Kate Winslet from 2011 movie, Contagion, introduce the concept of R0 in about 10 seconds: https://www.youtube.com/watch?v=VrATMF_FB9M
- Do some epidemiological studies. There is a great module on the CDC website, complete with slides for teacher use (11).
- Have students choose a section to research from the JAMA article, Characteristics of and Important Lessons from the Coronavirus Disease 2019 (COVID-19) Outbreak in China (12). Then, report back to the whole class in jigsaw style.
- Deconstruct the epidemic curve (“epi curve”) of that same article (12).
- Show some video clips about herd immunity (13 & 14), especially if you had the students complete Worksheet 2.
- Have students compare COVID-19 to MERS and SARS. Compare and contrast. Ask them to look into the zoonotic origin. What are zoonoses/zoonotic diseases (15 and 3)?
- Some more fabulous resources to share with your students in references (16 & 17). Check in back in with those resources periodically as a class.
REFERENCES 
- CDC.gov Science Fellowship program: https://www.cdc.gov/careerpaths/scienceambassador/index.html
- “Have You Herd” lesson plan: https://www.cdc.gov/careerpaths/scienceambassador/documents/hs-have-you-herd-modeling-influenza-2014.pdf
- COVID-19 vs. SARS-CoV2, and description of coronaviruses: https://www.merckmanuals.com/professional/infectious-diseases/respiratory-viruses/coronaviruses-and-acute-respiratory-syndromes-covid-19,-mers,-and-sars
- Why use an influenza lesson to teach about COVID-19? How is the United States preparing for a pandemic? https://www.cdc.gov/coronavirus/2019-ncov/php/pandemic-preparedness-resources.html
- Nasopharengeal samples for COVID-19 testing, described in “Specimen Type and Priority” section at https://www.cdc.gov/coronavirus/2019-nCoV/lab/guidelines-clinical-specimens.html
- Tests for COVID-19 described at https://www.cdc.gov/coronavirus/2019-ncov/about/testing.html
- R0 information – 9:00 min video for the teacher if you’ve never calculated “R-naught” AKA “basic reproductive number”: https://www.youtube.com/watch?v=jKUGZvW99os
- R0 for COVID-19: https://sph.umich.edu/pursuit/2020posts/how-scientists-quantify-outbreaks.html
- COVID-19 CDC Risk Assessment: https://www.cdc.gov/coronavirus/2019-nCoV/summary.html#risk-assessment
- Source and spread of SARS-CoV2: https://www.cdc.gov/coronavirus/2019-nCoV/summary.html#source-spread
- Introduction to Epidemiology: https://www.cdc.gov/publichealth101/epidemiology.html#anchor_topics
- JAMA Network article synthesizing CDC data: https://jamanetwork.com/journals/jama/fullarticle/2762130?guestAccessKey=bdcca6fa-a48c-4028-8406-7f3d04a3e932&utm_source=For_The_Media&utm_medium=referral&utm_campaign=ftm_links&utm_content=tfl&utm_term=022420
- Herd immunity – 3:31 min video: https://kcpt.pbslearningmedia.org/resource/nvvs-sci-herdimmune/herd-immunity/
- Herd immunity – 2:17 min video: https://www.youtube.com/watch?v=oAJDoLbrNRE
- Zoonotic Diseases/Zoonoses – why are they so deadly? https://bionexuskc.org/coronavirus-outbreak-raises-questions-why-are-bat-viruses-so-deadly/
- Current situation report, compiled by the World Health Organization: https://www.who.int/emergencies/diseases/novel-coronavirus-2019/situation-reports
- Rolling updates on Coronavirus from World Health Organization: https://www.who.int/emergencies/diseases/novel-coronavirus-2019/events-as-they-happen
 Previous Post